
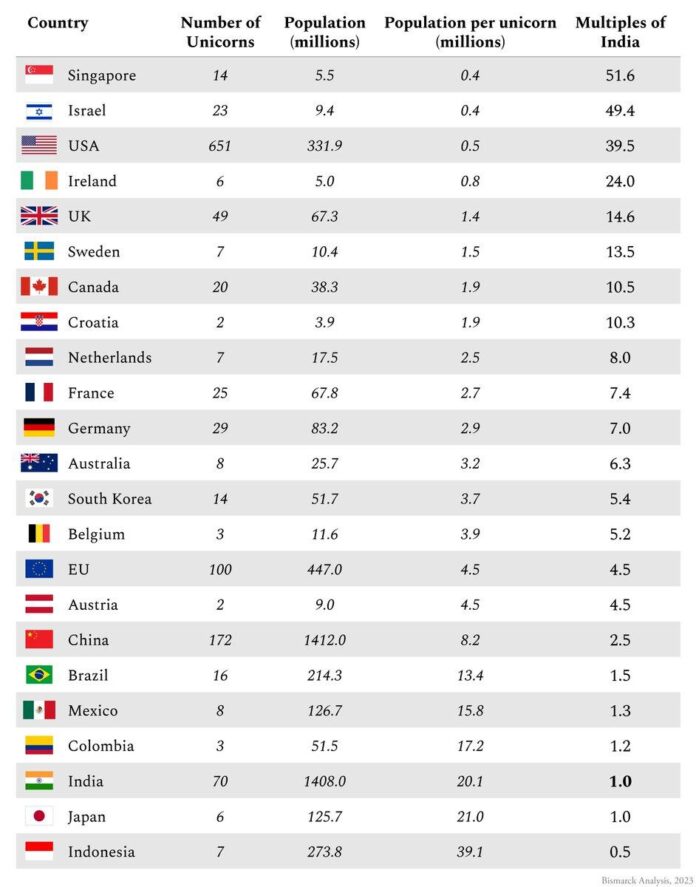
India has the third‑highest number of unicorn startups worth over $1 billion, after the U.S. and China. But the per‑capita picture tells a different story: both China and India lag behind several European countries, while the United States trades places with small, rich innovation hubs like Israel and Singapore. Absolute counts reward large populations; per‑capita metrics reward intense, concentrated startup activity. For investors and policymakers the difference matters — scale doesn’t always mean density or resilience. This piece unpacks why per‑capita rankings reshape our view of the global startup geography, what drives those differences, and who the real overachievers are.
Global Unicorn Counts vs Per‑Capita Reality
India has the third‑highest number of unicorn startups worth over $1 billion, after the U.S. and China. But the per‑capita picture tells a different story: both China and India lag behind several European countries, while the United States trades places with small, rich innovation hubs like Israel and Singapore. Absolute counts reward large populations; per‑capita metrics reward intense, concentrated startup activity. For investors and policymakers the difference matters , scale doesn’t always mean density or resilience. This piece unpacks why per‑capita rankings reshape our view of the global startup geography, what drives those differences, and who the real overachievers are.
Singapore: Per‑Capita Champion of Billionaires and Unicorns

Singapore’s performance per capita isn’t an accident: it tops global rankings for both billionaires and unicorns because of deliberate policy choices. The city‑state pursued a white‑collar growth model , strong rule of law, low corporate taxes, generous tax treaties, and a skilled, immigrant‑friendly talent pipeline. Agencies like MAS, EDB and Startup SG offer grants, regulatory sandboxes and clear governance that lower friction for fintechs and deep‑tech startups alike. Sovereign investors such as Temasek and GIC also channel capital and credibility. With a compact population the math favors high per‑capita numbers, but the strategic mix of policy, capital and connectivity is what truly produces sustained entrepreneurial density.
Language, Law and the Anglophone Advantage in Startups

Startups and venture capital behave like social technologies , systems built on shared legal frameworks, cultural practices and interpersonal networks. Many of their conventions, from corporate law norms to term‑sheet shorthand, grew out of Anglophone traditions of commerce and English‑language legal systems. That historical backward‑compatibility helps explain why Silicon Valley’s model exported so easily across English‑speaking markets, and why investor‑founder communication is smoother in those locales. It doesn’t mean non‑Anglophone regions are doomed; but differences in contract law, investor protections, and commercial culture create translation costs. Adapting the venture model often requires institutional reforms , from corporate governance to startup finance instruments , plus cultural shifts in risk tolerance.
Numbers Breakdown: U.S. Leads; China, India, Europe Follow
Of roughly 1,204 unicorns globally, the United States accounts for 651 , about 54% , underscoring its dominant position in late‑stage private tech. China holds roughly 14.3%, while India contributes about 5.8%; the UK alone is 4.1% and the entire European Union about 8.3%. Those numbers mix market size, depth of capital markets and national policies: the U.S. benefits from mature VC networks, deep public markets and serial entrepreneurship. China’s scale and funding firepower sustain a large share, while India’s rising count reflects rapid startup creation from a large population. Remember these are snapshots: valuations shift, exits happen, and measurement choices matter.