

Have you ever wondered if fast market moves could reveal smarter trading opportunities? The VIX acts like a weather forecast for the stock market, taking sudden price changes and turning them into hints about investor mood. It’s a simple tool that gives traders a peek at what might be coming next. In this piece, we explain what the VIX measures and how its clear calculation helps investors plan ahead. Get ready to see how this tool brings a little more clarity to an often unpredictable market.
Understanding the VIX: Definition & Market Significance
Volatility is all about how much prices change in a short period. It’s a bit like the weather, one moment things are clear and calm, and the next, they can turn stormy without warning. Just imagine planning your day only to be caught off guard by a sudden downpour; that’s what unexpected market shifts can do to investors. For more details, check out define market volatility. Knowing this helps investors plan ahead for both smooth sailing and choppy waters.
The VIX is a standout figure in financial markets. Created by the CBOE in 1993, it estimates the market’s mood for the next 30 days by looking at real-time option prices of the S&P 500. In simple terms, it turns quick price moves into easy-to-understand percentage points. Often called the “fear index,” the VIX shows how nervous or confident traders feel, giving a quick snapshot of market sentiment.
Keep an eye on the VIX because its behavior is a key part of managing risk. When the VIX jumps, it means uncertainty is on the rise and caution is increasing among investors. That surge can be a useful prompt for adjusting trading strategies or hedging against a downturn. Essentially, the VIX transforms vague market worry into clear, actionable insights, making it a vital tool for smart financial planning.
VIX Calculation Techniques & Formula Derivation
We begin by looking at live S&P 500 option quotes that expire between 23 and 37 days. This range is picked to mimic a steady 30-day period, much like setting a timer when cooking, you get just the right result every time, smoothing out irregular daily market fluctuations.
The formula behind the VIX is made up of several important parts. It includes option strike increments, mid-quote prices, and the time left until each option expires. It also takes into account the forward index level and a discount factor for the time value of money. Think of these elements as puzzle pieces that all need to connect correctly. Each small detail, from an option’s price right to its lifespan, plays a role in showing us how volatile the market feels.
After calculating the raw variance, the next step is annualization. This process scales up the daily expectations to a yearly basis, letting us see the big picture. The final result is shown as a percentage, similar to a yearly forecast. It’s like turning a quick snapshot into a full, detailed timeline. This makes it easier for traders to weigh risks and compare market trends accurately.
Overall, by selecting the best expiration window, breaking down the components of the formula, and annualizing the variance, we turn complex option data into a clear and practical tool. In doing so, we can better understand investor sentiment and how uncertain the market might be.
Historical Evolution of the Stock Market Volatility Index VIX
Back in 1993, the CBOE introduced the VIX to measure the implied volatility of SPX options. It quickly became the go-to tool for spotting market risk, giving investors a clear picture of how much prices might shift soon.
In 2003, the index underwent a major update. They reworked the calculation methods, much like fine-tuning a sensor, to make the readings more consistent. This change made the VIX easier to use for everyone, from casual traders to market experts.
Then in 2014, weekly options were added to improve its ability to catch short-term market movements. More recent research by Andersen and Todorov even led to creating the SPOTVOL and LTV indices. These help separate everyday price changes from the risks of sudden, extreme events. All of these updates have helped transform the VIX into an even sharper tool for measuring market risk.
Trading Strategies & Risk Management with the VIX

VIX-linked instruments like futures, options, ETFs, and CFDs give traders a handy set of tools to navigate market ups and downs. They help investors get ready for shifts in market sentiment. For example, if you expect the market to turn volatile because of rising fear, you might benefit from a long VIX position. And when conditions become calmer, a short VIX play can work well. This mix makes these products a flexible choice no matter how the market feels.
Different products fit different trading goals. VIX futures and options spreads offer a direct handle on changing volatility, while CFDs and ETFs keep things simple with their flexibility and ease of trading. Each tool has unique features that make it suitable either for catching quick price moves or for protecting a long-term portfolio from risk.
• VIX futures longs/shorts
• Options straddles and strangles
• Short-term VIX ETFs and ETNs
• CFD positions on the volatility index
• Tail-risk hedging via volatility swaps
• Dynamic hedging with variance products
Risk management is key when working with these strategies. High leverage and factors like contango in futures products mean that setting clear stop-loss levels is a must. Adding variety to your positions can protect you even further. It might also help to try these strategies on a demo account first to build your confidence and sharpen your risk controls. With careful planning and regular monitoring, using VIX-based tools can add an extra layer of protection, and a chance for profit, to your investment strategy.
VIX Futures & Term Structure Analysis
The Chicago Board Options Exchange (CBOE) lists both monthly and weekly VIX futures. These contracts have clear expiry dates that help traders see what the market expects over different time frames. Front-month futures offer quick insights into current volatility, while contracts set for later dates reveal how risk might build over time. This setup lets traders compare short-term jitters with longer-term trends.
Contango vs. Backwardation
In plain terms, contango happens when the price of a future is higher than today’s spot price. This usually tells us that traders expect volatility to increase over the long haul. On the other hand, backwardation is when the front contract trades at a premium compared to those with later expiries. It’s like comparing a weather forecast for tomorrow versus next month – the differences guide investors on whether to prepare for immediate swings or a slower change in market moods.
Term Structure Shifts
Watch how the gap between front-month and later futures changes. When that gap grows, it may hint that short-term worries are ramping up. If the range tightens, it could mean there’s a steadier vibe, both now and in the near future. By keeping an eye on these shifts, traders can get a clearer picture of both immediate risks and long-term trends.
ETF/ETN Tracking
Some products, like VXX, use a rolling basket of short-term VIX futures to mirror market volatility. These ETFs or ETNs let investors track the index easily without juggling multiple contracts. They adjust automatically as each contract nears its expiry, ensuring investors stay connected to the volatility premium.
| Instrument | Typical Use | Structure Signal |
|---|---|---|
| Front-Month Future | Short-term volatility speculation | Spot vs. Month-2 spread |
| Back-Month Future | Longer horizon strategies | Month-2 vs. Month-3 slope |
| Short-Term VIX ETF | Passive day-to-day tracking | Constant roll impact |
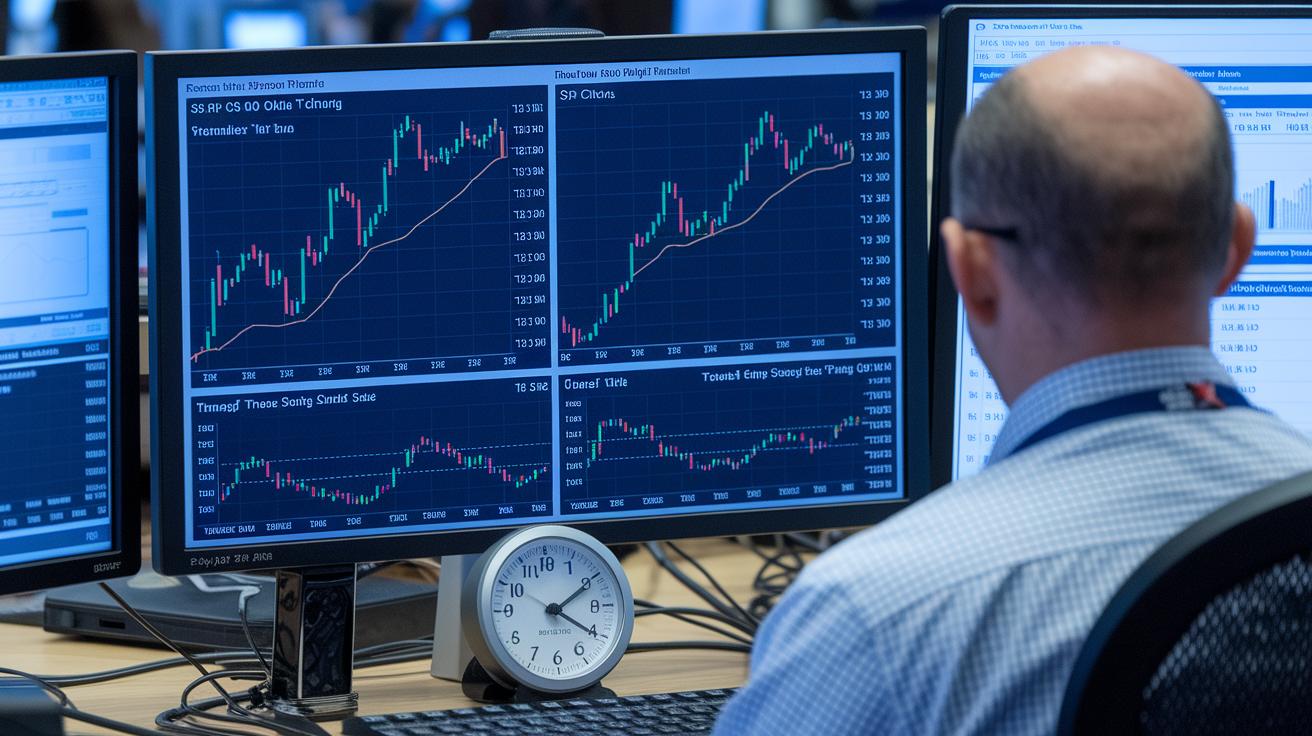
Real-Time VIX Data & Chart Analysis Tools
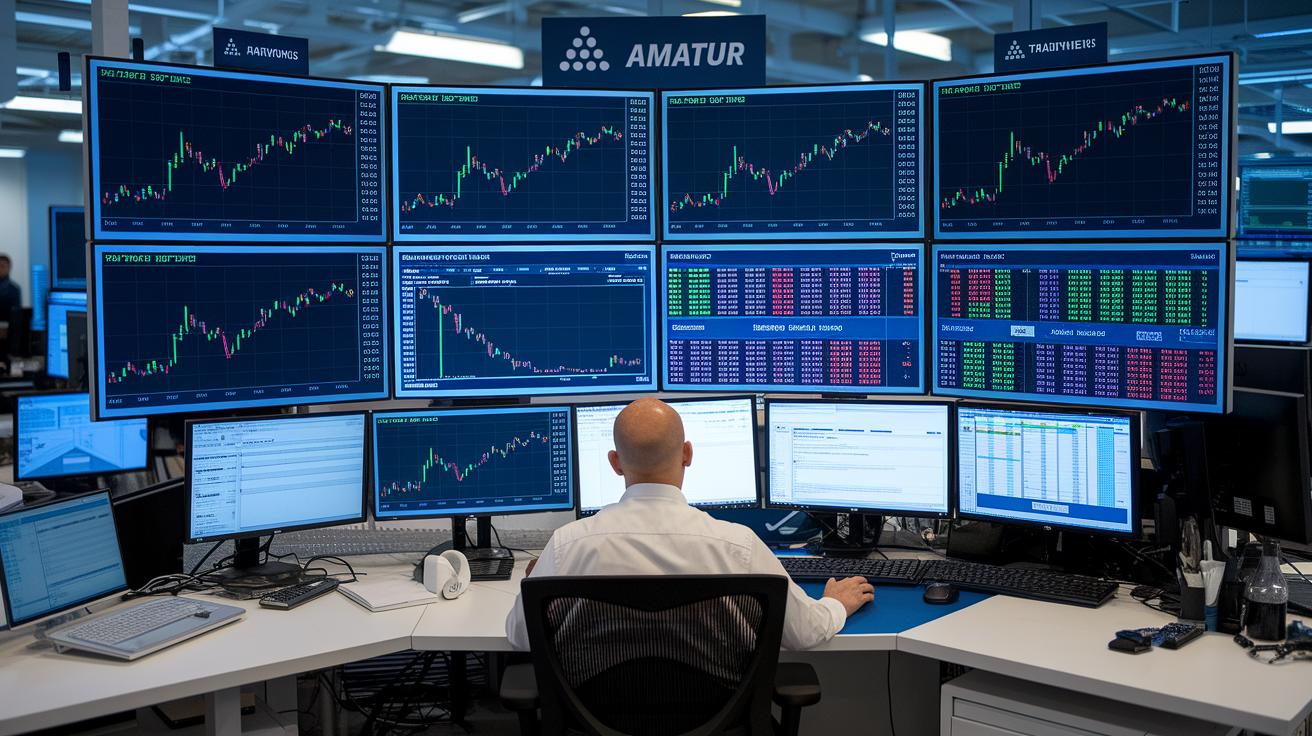
Real-time VIX quotes are easy to find with trusted sources like the CBOE, Bloomberg, and well-known financial news sites. These updates give you the current details that busy traders rely on for smart, quick decisions. Platforms like TradingView make it even better by showing live overlays. This lets you see present VIX levels along with other market signs. MarketWatch also offers daily volatility updates and historical charts so you can keep an eye on trends as they shift. With these handy tools, investors get a clear picture of market movements and can react quickly when important signals appear.
Trading platforms like TradingView provide powerful chart features that turn complex information into simple visuals. You get useful tools such as moving averages, Bollinger Bands, and real-time alerts that help explain market swings. Have you ever noticed a spike-and-reversion setup? It often hints at short-term trading chances. Likewise, moving-average crossovers usually signal a change in market momentum. These easy-to-follow visuals make trading decisions clearer and help deepen your understanding of market behavior.
Stock market volatility index vix: Market Clarity Ahead
The VIX sits next to other volatility gauges like the VVIX, VXN, and DjVIX. Each index shows a different view of market mood. For example, the VIX gives a peek at expected 30-day ups and downs in S&P 500 options, while the VVIX tracks how wildly the VIX itself swings. The VXN tells us about the Nasdaq 100’s vibe, and the DjVIX shines a light on the Dow. Together, these tools let investors compare uncertainties across different parts of the market.
A key part of these analyses is how the VIX correlates with the S&P 500. When the market dips, the VIX tends to jump, showing a negative correlation between -0.6 and -0.8. In simpler terms, as prices fall, volatility climbs. A straightforward formula, Corr(X,Y) = Cov(X,Y)/(σXσY), helps us see how tightly these moves match up. These links change with market moods, giving traders a full picture of risk and sentiment.
When picking tools for your portfolio, comparing these volatility gauges adds a layer of clarity. Investors can match index-based hedges to their specific market exposures. Whether you’re tracking broad equity trends or focusing on risks in segments like Nasdaq or Dow components, these measures guide your decision-making every step of the way.
Final Words
In the action, we examined the fundamentals of the stock market volatility index vix. We broke down its definition, calculation methods, and historical evolution. We also connected trading strategies, risk management techniques, and real-time data insights to provide a clear picture of market sentiment. Each section offered straightforward details to support smart, data-driven decisions. This analysis underlines the importance of informed strategy and a balanced approach to risk. The market keeps moving, and these insights can spark success and renewed confidence.
FAQ
What do real-time VIX data, charts, and historical data show?
The real-time VIX data, charts, and historical data provide a snapshot of investor sentiment and expected market volatility. They help gauge market stress and track risk trends over time.
What is the VIX in the stock market and why is it known as the fear index?
The VIX measures the expected 30-day volatility for the S&P 500 using real-time option prices. It reflects market apprehension, which is why spikes in the VIX signal increased fear.
How does the VIX compare to the S&P 500?
The VIX has an inverse relationship with the S&P 500; as market returns fall, the VIX generally rises. This helps indicate shifts in investor mood and overall market risk.
What is considered a good VIX index value?
The VIX value is relative; numbers around 15–20 typically suggest normal market conditions, while values outside this range may point to greater uncertainty or subdued risk sentiment.
Should investors buy when the VIX is high or low?
The VIX level offers different market signals; high readings can present hedging opportunities during stress, while low readings often signal calm. Investors should align decisions with their risk strategy.