

Have you ever noticed how prices can change so quickly during market hours? It’s all about liquidity working like a smooth stream that keeps trades moving and keeps prices near their true value. When buyers and sellers easily connect, asset prices quickly settle at their real worth.
In this article, we dive into the link between fast trades and smart pricing. We’ll explore how market behavior and the actions of central banks build a dynamic push that makes liquidity a crucial driver for accurate price discovery.
How Liquidity Drives Accurate Price Discovery in Markets
Price discovery happens all the time when buyers and sellers agree on what something is really worth. It’s a constant back-and-forth. When many buyers show up against a fixed supply, prices naturally move higher. This simple example shows how market forces work in real time.
Liquidity means you can quickly turn an asset into cash without causing big price swings. Think of it like a busy stream where water flows steadily. In markets like major stock exchanges, trades happen fast and smoothly, keeping prices stable. For example, when there’s a high volume of trades in a commodity, the small gap between buy and sell prices helps keep things steady, much like a well-tuned engine.
Central banks also play a big role by adjusting the cash in the market through their policies. Their actions can change how much money is available to trade. When liquidity is high, prices update quickly with new information, so mistakes in pricing are less likely. But if an asset is hard to sell fast, its price might drop below what it’s really worth during tough times.
Imagine a bustling marketplace where every trade adds a piece to the puzzle of a product’s true value. That clear picture is what liquid markets bring. It keeps prices in sync with real value, helping traders make smart, informed decisions.
Essential Liquidity Metrics for Valuation and Cost Formation
Liquidity metrics offer a clear look into the market’s inner workings, showing not only its depth but also the cost of trading. One simple yet powerful measure is the bid–ask spread. This spread is just the difference between the buying and selling prices. For example, in markets like gold or oil, you might see spreads that are only a few cents wide, traders quickly notice how smooth their transactions become when costs are so low. On the other hand, in more specialized areas like niche real estate or exotic derivatives, wider spreads mean each trade can cost you a bit more.
Another metric to consider is the turnover ratio, which compares the trading volume to the number of outstanding shares. High turnover in commodities signals lively trading and steady market movement, while a low ratio in real estate might indicate that trades are made slowly and with more caution. Also, the speed of settlements plays a big role. In today’s digital markets, transactions settle almost instantly, which helps keep sudden price swings in check.
Then there’s market depth and resilience. This tells you how well an order book can handle large trades without losing balance. In cases like customized OTC contracts, a thinner order book might lead to more unpredictable prices.
- Volume analysis methods
- Bid-offer gradient evaluation
- Depth examination methodology
- Spread difference evaluation
These liquidity metrics act as fundamental tools, letting us gauge trading efficiency and ensure that prices remain true to market conditions. Isn't it interesting how a few key numbers can tell you so much about market behavior?
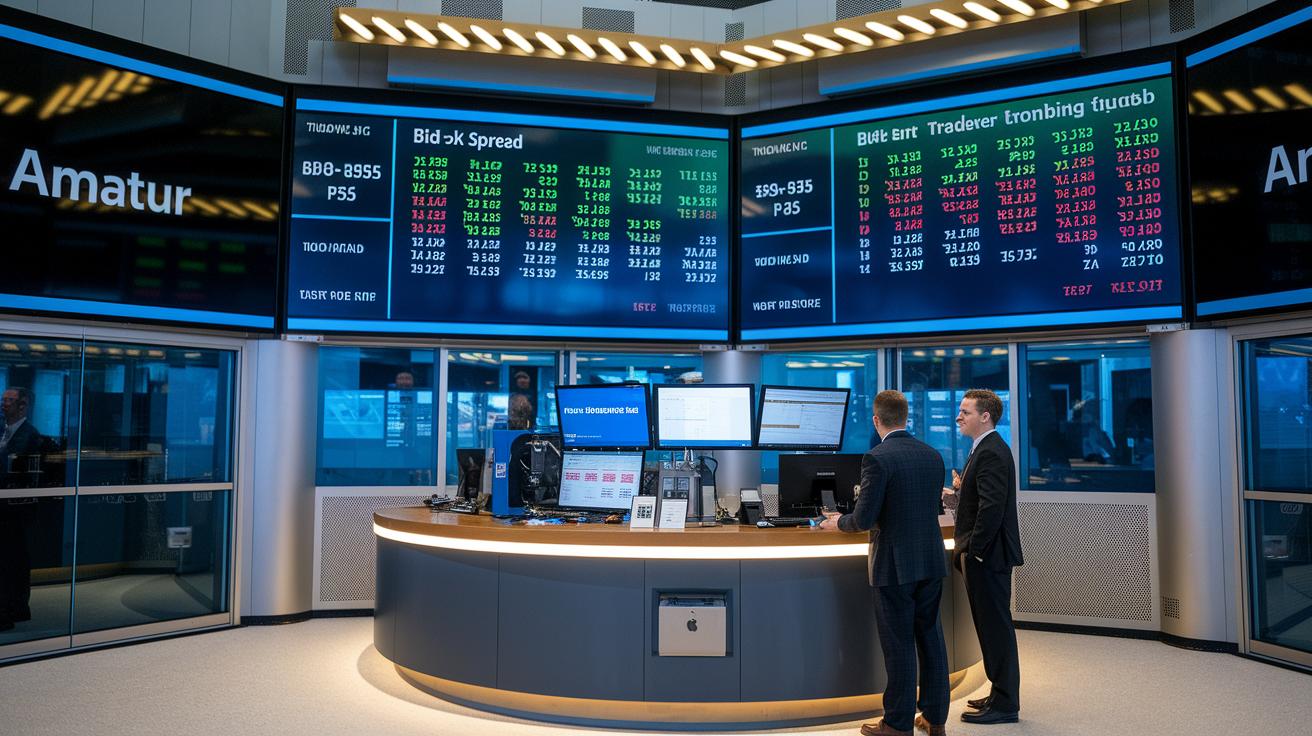
Market Microstructure Insights into Liquidity and Price Formation
Automated real-time trading platforms have swapped out slow local chats for fast, efficient matching of buy and sell orders. This technology helps prices adjust in just seconds, saving time and keeping liquidity flowing smoothly, almost like a steady market heartbeat.
Algorithms play a key role here. They scan market data in milliseconds, picking up small details that drive trades. It’s like having a quiet conversation between supply and demand that happens faster than you can blink.
Auction sessions also make a big difference. During opening and closing, liquidity surges in short bursts, so even tiny orders can shift prices noticeably. This blend of smart technology and real-time systems creates a market that truly reflects investor mood and liquidity levels.
Empirical Examples of Liquidity and Price Discovery Across Asset Classes
Equities show us how quickly liquidity and price discovery can change. When companies announce their earnings, prices jump in response. For example, a surprising earnings beat often sparks a rapid surge in trading volume as investors adjust their positions almost instantly.
Commodities act a bit differently. Even with high trading volumes supported by standard contracts, prices can shift suddenly if macroeconomic or geopolitical events shake the market. Imagine oil prices dropping unexpectedly after economic news. The quick trades show how market sentiment can flip in a heartbeat.
Real estate tells another story. This market moves slowly because of high transaction costs and lengthy settlement processes. Price changes in property tend to be less responsive, though supply and demand imbalances become clear during tough periods.
Derivatives, especially those traded on exchanges, highlight effective asset flow analysis. They offer a deep, robust order-book that can handle market stress. In contrast, over-the-counter instruments often struggle with low liquidity, resulting in wider bid-ask spreads when the market gets rough.
- Asset flow analysis
- Provision model structure
- Imbalance effect overview
- Settlement speed evaluation
Each asset class presents its own set of challenges for price discovery. In all cases, liquidity is key to showing the true market sentiment and maintaining fair valuations.
Technological Innovations Enhancing Liquidity and Price Efficiency
Blockchain tokenization is opening doors for fractional trading. It lets you break up big assets like real estate or art into smaller parts that you can buy and sell. Think of it like owning a piece of a famous painting, which makes a pricey asset easier to invest in.
Automated systems are also changing how we trade. Electronic trading platforms now use APIs to keep orders flowing and prices tight. These systems rely on smart automation and real-time data to match orders almost instantly. Picture an algorithm that tweaks prices the moment a buying surge happens, almost like the market is breathing and reacting as it goes.
Real Estate Investment Trusts and loan securitization add another layer of liquidity. They pool together assets into securities that can be easily traded on public markets. By combining blockchain, automated signals, and swift data updates, the market becomes more dynamic. This means traders and investors get a clearer and faster snapshot of asset values.
Risks and Challenges in Liquidity-Driven Price Discovery

Sometimes traders use tactics like spoofing and pump-and-dump schemes that make it hard to find a fair price. When these methods are in play, they create a fake sense of supply or demand, which throws off the asset’s true value. Think about a pump-and-dump: prices shoot up quickly only to plunge moments later, leaving many investors in a tough spot.
High fees and slippage in thin markets add even more challenges. Every trade might happen at a price that doesn’t reflect the asset's real worth. It’s like trying to get an honest answer in a game where the rules keep changing.
Latency arbitrage is another trick up some traders’ sleeves. Fast traders scoop up advantages when others lag behind, which can widen the gap between what buyers and sellers expect. Have you ever wondered how a tiny delay can shake up the whole market's fairness?
- Transaction fees: Raise the cost of trades in tighter markets.
- Slippage control: Is key to reducing deviations between execution and market prices.
- Latency effects: Spotlight the speed gaps between market players.
- Quick correction strategies: Work to bring prices back to balance after sudden swings.
These risks can really undermine market efficiency, especially when low liquidity makes honest price discovery a real challenge.
Final Words
In the action, the blog highlighted how liquidity influences asset pricing through buyer-seller interactions. It explained practical metrics like turnover and bid–offer spreads that gauge market depth and reinforce fair valuations.
It also examined how trading algorithms and technological advances enhance real-time clarity. Examples from equities to derivatives illustrated the role of market microstructure.
A solid balance between liquidity and price discovery in markets supports fair asset pricing and helps professionals make confident, data-driven decisions.
FAQ
What does liquidity and dynamic price discovery in markets mean?
Liquidity and dynamic price discovery refer to how quickly assets are converted to cash and how fair market values are set through ongoing buyer–seller talks. This leads to more accurate pricing in active markets.
What does spot price mean and how does it differ from market and future prices?
The term “spot price” means the current trading cost of an asset. In contrast, future prices represent expected values, while market price is shaped by immediate supply–demand interactions.
How do market forces of supply and demand influence asset pricing?
Market forces balance how many buyers there are against asset availability. This equilibrium drives price changes, ensuring that prices reflect current trading dynamics and remain responsive to shifting demand.