

Have you ever wondered why stock prices sometimes feel like a wild roller coaster ride? It all comes down to market volatility, that’s just a fancy way of saying how quickly prices can change over a short time.
In this article, we show you how these fast shifts can point to different risk levels and steer your investment choices. Picture the market like a busy trading floor where every small change might be telling you something important. With straightforward examples and clear insights, you'll see how even tiny moves can hint at bigger trends ahead.
Ready to uncover the clues hidden in the market's ups and downs?
Market Volatility Explained: Core Definition and Significance
Market volatility simply means how much prices change over time. It shows the range of ups and downs that investors might face. When prices jump up or down quickly, we call the market volatile. For instance, imagine a stock that rises 8% in just one hour – that tells you how fast market trends can flip.
High volatility means prices can change a lot in a short period. Investors often view these quick swings as higher risks, using a change of more than 1% as a common benchmark. This measure helps clarify moments of financial turbulence that could impact investment decisions.
Volatility also points to the natural risk in the market. Steady, gradual changes usually hint at stability, while sudden, large moves suggest a riskier environment. Consider a day when unexpected news causes dramatic price shifts – that's a clear example of market uncertainty.
Understanding market volatility is key for weighing risks and spotting opportunities. It sets a clear framework that helps investors know when to play it safe and when to seize a chance.
Measuring Market Volatility: Statistical Tools and Key Indicators

Market volatility shows how much prices jump around and gives investors a clear sense of risk. We use simple tools like variance and standard deviation to see how far prices stray from their usual average over a period. These numbers help traders understand the ups and downs in their funds.
Historical volatility looks at what happened in the past. For example, if a stock's price moves 2% away from its average over the last month, that tells us about its recent behavior. Implied volatility, on the other hand, uses options pricing to guess what might happen next, offering a snapshot of future price swings. Ever wonder how some investors seem to predict these shifts?
Then there’s the VIX, known as the fear index. When markets get choppy, the VIX often spikes, signaling a sudden rise in uncertainty among traders for the next 30 days. Professionals around the world keep an eye on it to get a feel for the market mood.
Below is a quick look at the main tools used to measure price movements:
| Tool | Purpose |
|---|---|
| Variance & Standard Deviation | Measure how far prices stray from the average |
| Historical Volatility | Show past price behavior |
| Implied Volatility | Estimate future fluctuations |
| VIX | Track near-term market sentiment |
Each tool adds a piece to the big picture, helping you manage risk and seize opportunities when the market shifts. Isn’t it fascinating how numbers can paint such a clear picture of our financial world?
Drivers of Market Volatility: Causes and Market Dynamics
Market volatility happens when many different factors push prices to change in an instant. New details, like economic reports, earnings news, policy updates, or events abroad, can cause investors to react very quickly. Have you ever noticed how a single unexpected headline can trigger a flurry of trades?
Sometimes, shifts in supply and demand make prices swing sharply. For example, if everyone suddenly wants something while the supply stays the same, prices can quickly jump. These clear signals of a shortage, or even an oversupply, reveal how the market adjusts to new conditions. And when global tensions or economic surprises hit, traders often question their strategies in response to daily uncertainties.
Investors don’t always act alone. When they rush in together, this herd behavior can really ramp up price moves, leading to even faster shifts. In many cases, one important event can set off a series of quick trades, forcing everyone to rethink the balance between risk and reward. Understanding these triggers helps market participants decide when to switch up their strategies in a world that’s constantly shifting.
define market volatility: Crisp Market Clarity
Market volatility is best understood by looking at real events. Imagine a sudden burst of uncertainty suddenly sending prices on a wild ride across different markets. In March 2020, for example, the VIX soared above 80 during the COVID-19 crisis. That spike felt like a smoke alarm alerting traders to an approaching storm. This example shows just how quickly investor moods can change and how outside events can make prices swing.
During the 2008 financial crisis, major stock indices jumped more than 5% each month from their usual range. This measure of how far prices stray from the norm painted a clear picture of extreme uncertainty. Those rapid swings forced many investors to re-evaluate their strategies.
The commodity market gives us another striking example. In 2020, oil prices once dropped or surged by more than 30% in a single day. This dramatic change reminds us that volatility isn’t just about stocks, it can affect other asset classes and send ripples through the global economy.
Looking back further, the market crash of 2001 provides a classic look at these erratic price changes (market crash of 2001). These historical case studies help us understand why prices move, how assets fluctuate, and the ever-changing rhythm of financial markets.
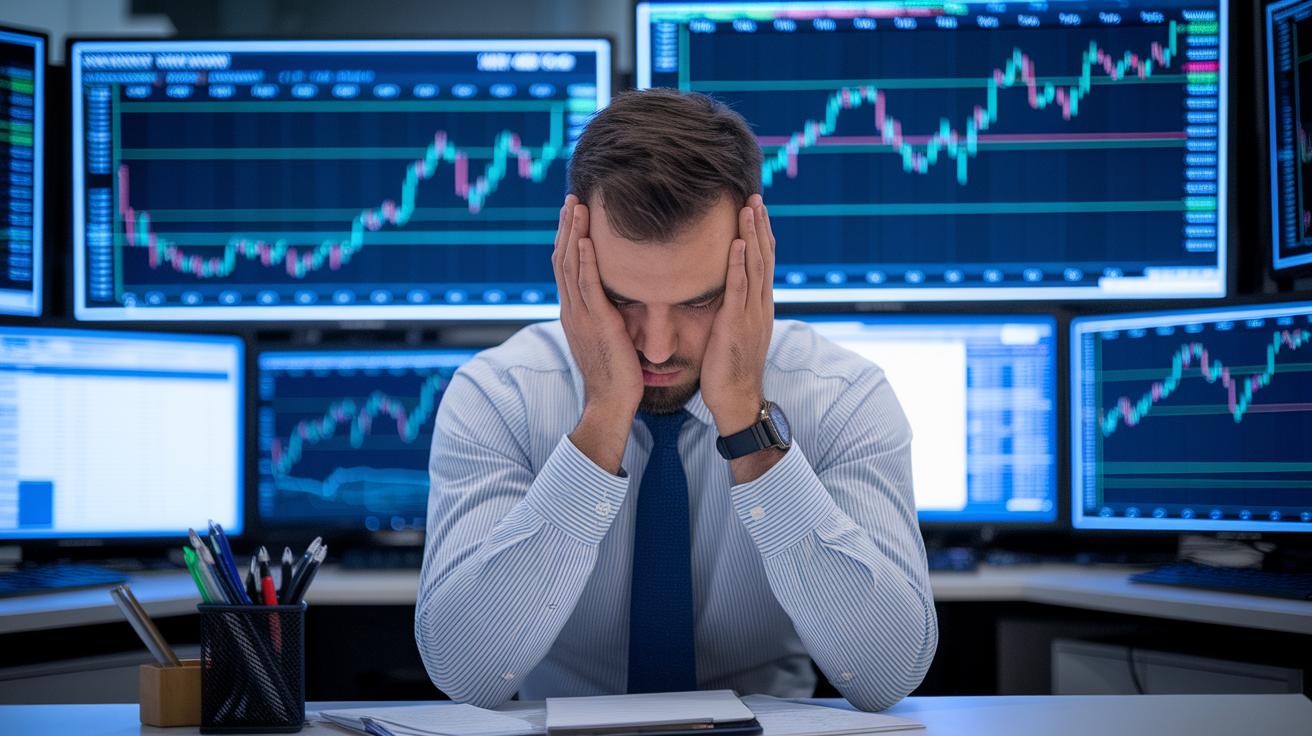
Impacts of Market Volatility on Traders and Investors
Market ups and downs affect everyone in trading. Traders often use options and futures to catch fast shifts in prices. One trader, for example, grabbed a 10% gain by acting quickly when prices spiked. It’s a clear sign that fast moves can lead to quick rewards.
Long-term investors handle these swings by mixing different kinds of assets in their portfolios. They spread out their investments across stocks, bonds, and other classes to lower risk. When the market shifts suddenly, these strategies help keep big losses at bay. For instance, an investor might put some money in steady bonds while keeping a share in more active stocks to balance risk.
Emotions run high during rapid price changes, and that can cloud judgment. Some investors might panic, selling when prices drop or rushing in during a surge, without a clear plan. This is why having a solid strategy is so important. Investors who stick to disciplined risk management tend to navigate these ups and downs more smoothly.
Periods of high volatility also change the way investors react. Some jump on opportunities to ride sudden trends, while others choose to wait and stay cautious. Even small shifts in market mood can lead to big changes in portfolios. By assessing these shifts and staying calm, traders and investors can reduce risks and keep their financial plans on track.
Strategies for Managing Market Volatility Effectively
When the market gets choppy, it’s important to have a few tricks up your sleeve. Savvy investors and traders use smart tactics to keep pace when asset prices jump up and down. These approaches help you understand market swings and manage returns while keeping risks in check. Staying calm and sticking to a long-term plan makes dealing with rapid changes a lot easier.
Risk management is really the heart of any good strategy. For example, diversification is key, you spread your investments across different assets to lessen the blow if one area takes a hit. Another useful tool is setting stop-loss orders, which automatically sell an asset if it falls to a certain price, helping you avoid big losses. And don’t forget position sizing, which means adjusting how much you invest in each asset so that even small dips don’t have a huge impact.
On top of that, options and derivatives let you hedge against the downside. These instruments help you navigate market shifts by balancing risk with smart moves, protecting your portfolio during unforeseen swings.
Keeping a long-term outlook with clear profit targets gives you a solid framework when things get volatile. Instead of reacting hastily to every market move, you can step back, analyze the trends, and act when the timing is right. This method not only helps limit losses, but it also sets you up to take advantage of rising markets once stability returns.
Final Words
In the action of grasping market dynamics, the article broke down how to define market volatility and its implications for investors.
It highlighted the methods to measure price shifts and the real-world drivers behind these ups and downs.
Actionable strategies for managing risk cut through the financial noise, offering clear guidance for both traders and long-term investors.
This discussion gives you practical insights to confidently face market challenges and seize opportunities.
Stay upbeat, stay informed, and remember that understanding market volatility can pave the way for smarter decisions.
FAQ
Define market volatility in economics?
Market volatility in economics is defined as the degree of price movement over time. It indicates how much prices fluctuate, reflecting the underlying uncertainty and risk in the economic environment.
Define market volatility in stocks and the stock market?
Market volatility in stocks shows the speed and extent of price changes in equity markets. It reflects investor sentiment and can be driven by various economic events and market trends.
What is volatility in trading?
Volatility in trading means rapid and unpredictable price shifts. It affects trading by creating both risks and opportunities, making it essential for short-term market strategies.
What is volatility in simple terms?
Volatility in simple terms is the measure of how much prices go up and down. It shows the level of market uncertainty and helps investors gauge potential risk.
What is volatility in chemistry?
Volatility in chemistry describes a substance’s tendency to turn into a gas. It is determined by how easily particles escape into the air, affecting processes like distillation.
What does stock market volatility today mean?
Stock market volatility today indicates current price swings and uncertainty. It helps traders and investors adjust strategies by revealing how rapidly prices are changing in the market.
What happens when volatility is high?
When volatility is high, prices experience dramatic swings over short periods. This results in increased uncertainty, prompting investors to adjust their strategies and manage risks more carefully.
Is market volatility good or bad?
Market volatility can be both beneficial and challenging. It offers opportunities for short-term gains but also increases risk, requiring careful management by investors and traders.
What does a volatility of 5% mean?
A volatility of 5% means an asset’s price typically varies by 5% from its average value during a set period. This signals moderate fluctuations and a corresponding level of market risk.
Can you give examples of market volatility?
Market volatility examples include the COVID-19 period when the VIX spiked and sudden drops in oil prices. These cases show how external events can cause rapid and significant market movements.