

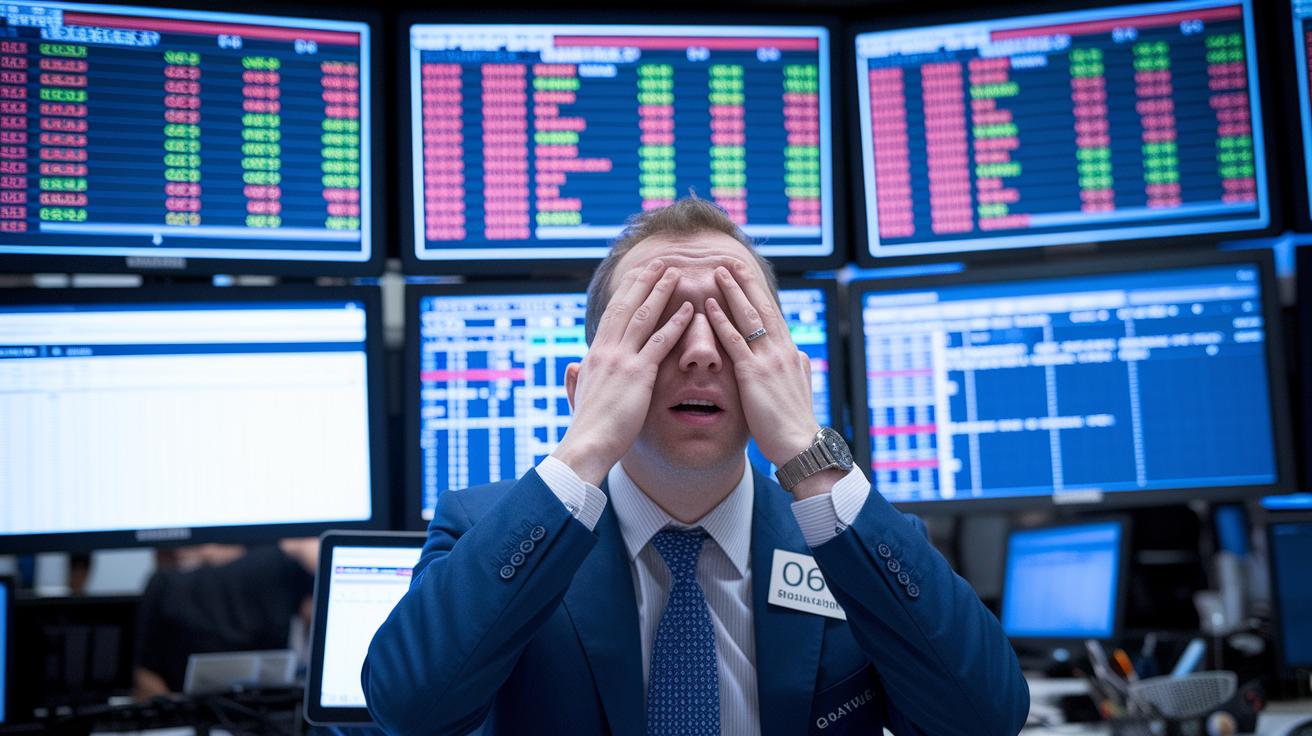
Have you ever thought that just one rough year could turn investing on its head? In 2001, tech stocks fell dramatically, and many people lost their confidence in the market. Billions vanished as indices plunged, forcing investors to rethink the way they handle speculation and risk.
This post takes a close look at how a major drop in tech shares and other sudden shocks changed investor habits. Big losses forced bold moves, and we learned some valuable lessons about preparing for market ups and downs. It’s a reminder for everyone to look at market stability with fresh eyes.
Market Crash of 2001: Key Causes, Major Events, and Economic Impact
The market crash of 2001 shook investor confidence and rattled economic stability. After the dot-com bubble hit its peak on March 10, 2000, with Nasdaq at 5,048.62, things took a sharp turn. Over the year, tech shares fell hard. The Nasdaq dropped nearly 39% while the S&P 500 slid about 11%. It felt like the tech sector and the wider market were exposed, leaving behind a tough economic lesson.
The crisis moved fast, leaving many to deal with big losses and shocking events. Corporate profits vanished and investor panic spread. It wasn’t just about technology; other industries suffered too. This sell-off made everyone realize how fragile an overhyped market can be. Factors that played a big role included:
- A bursting tech bubble
- Speculative trading
- Earnings misses
- A squeeze in liquidity
- The impact of the 9/11 attacks
The downturn was massive. As indices fell, trillions of dollars of wealth disappeared, showing just how quickly trust can crumble. Business leaders and policy makers were forced to rethink risk measures and valuation methods. The crash wiped out huge chunks of market value and raised tough questions about corporate oversight and unchecked speculation. In the end, the dramatic drop of overvalued tech stocks combined with external shocks taught everyone a crucial lesson: keeping a balanced market view and robust financial safety nets is more important than ever.
Market Crash of 2001 Timeline: From Dot-com Peak to Post-9/11 Turmoil

This timeline guides you from the high-energy days of the dot-com boom to the sudden uncertainty that followed 9/11. Every date marks a clear shift in market sentiment, nudging investors into worry and prompting swift policy responses.
| Date | Event | Market Reaction |
|---|---|---|
| Mar 10, 2000 | Nasdaq hit its dot-com peak | Record trading and high valuations |
| Mar 2001 | Signs of an early recession | Investor worries grew and trading slowed |
| Jan–Jun 2001 | The Fed cut rates several times | Efforts to boost market confidence |
| Sep 11, 2001 | Terrorist attacks led to market closure | A sudden stop and rising panic |
| Sep 17, 2001 | The market reopened | Spike in volatility with VIX jumping from around 19 to about 44 |
| Post-reopening, 2001 | Trading remained volatile | Sharp price swings amid deep uncertainty |
| Oct 9, 2002 | The S&P reached its lowest point | Marked the bottom before the start of recovery |
Each turning point added its own weight to the tension, from the blinding tech peak to quick policy fixes, then a sudden market shutdown and reopening. It’s a story of rapid shifts where one event piled on the next, reminding us how quickly market moods can change and why clear, coordinated responses are so crucial.
Market Crash of 2001 and the Dot-com Bubble Burst: Tech Stock Plunge Analysis
Before the crash, tech stocks were soaring to unbelievable heights. By late 1999, many companies had price-to-earnings ratios over 200. It was like paying an outrageous price for a toy because you believed it would be the next big thing, until reality knocked hard.
Heavy borrowing made matters even worse. In Q2 2000, margin debt hit $211 billion, pushing investors to take big, risky bets. Picture someone betting with borrowed money; when things turned sour, there was no safety net, and losses piled up fast. This rush to sell based on margin debt spread panic, causing many investors to exit their positions to avoid even bigger losses.
By the end of 2001, investor trust was nearly wiped out. The Nasdaq lost about two-thirds of its value from its peak, erasing more than $5 trillion in market cap. This dramatic change shows just how fast market moods can flip, from wild speculation to a rush for safety, and reminds us of the dangers of overvaluation and unchecked risk.
September 11 and the 2001 Market Crash: Economic Shock Effects
On September 11, trading came to an abrupt stop and remained frozen until the 16th. When the Dow reopened on the 17th, it plummeted by 684 points, roughly 7.1%, as investors rushed to sell in a state of panic. The shock spread quickly, and the volatility index nearly doubled, reflecting the surge in nervous, emotionally driven decisions. Imagine walking into your office to find stock values crashing without warning.
Different sectors experienced the shock in their own ways. Airline stocks tumbled by more than 40%, while both the insurance and tourism sectors suffered losses exceeding 20%. These steep declines revealed the vulnerabilities of industries deeply linked to travel and consumer trust. This dramatic shift reminded everyone just how tightly our modern economy is connected to global events, forcing investors to rethink risk controls and safety nets in a climate filled with uncertainty.
Federal Reserve Policy Shift and Government Intervention During the 2001 Market Crash
The Fed acted quickly in 2001. They dropped the funds rate from 6.5% in January to 1.75% by December. In five steady cuts, they made it cheaper to borrow money. Think of it as lowering fuel prices during a shortage to keep cars running, only here it was about boosting economic confidence.
On the fiscal side, the government also stepped in. The Economic Growth and Tax Relief Act passed in June 2001 handed out rebates of up to $300 per person. This move was designed to put extra cash in people’s pockets when spending was down, much like offering discounts during a slow season.
At the same time, lawmakers worked on restoring trust in the market. The Sarbanes-Oxley Act was signed in July 2002 to tighten corporate rules and improve transparency. By building more oversight into the system, the act aimed to reassure investors and reduce risky behavior. Together, these bold steps offer clear lessons on how focused policies can help steady the economy during tough times.
Market Crash of 2001: Bold Lessons
After the downturn, the market bounced back quickly. On October 9, 2002, the S&P 500 hit a low of 768, showing just how painful the drop was. But soon enough, early hints of recovery started to show up. In the months following the crash, the service sector picked up nicely, and GDP numbers improved in the final quarter of 2001. Consumer confidence began to steady while unemployment peaked at 6.3% in June 2003 before slowly turning around. This cautious return of investors showed they were ready to move past the shock and set the stage for a broader recovery.
Over the next year, a solid rally began to take shape. By October 2003, the S&P 500 was back at levels last seen in March 2000. A steady policy environment helped a lot too. The Fed kept the funds rate at 1.75% until mid-2003, which boosted market sentiment. During this time, smart market reforms and careful risk-taking helped build a recovery that wasn’t just temporary. Improvements like a stronger service sector and gradually falling unemployment proved that the market was slowly getting back on track.
In the end, steady policy support, recovering corporate earnings, and flexible business strategies drove the rebound. These factors rebuilt investor trust and reinforced key market practices, showing that even tough downturns can lead to strong and lasting recoveries.
Market Crash of 2001 Compared with Other Major Stock Market Crashes
Market downturns show up in many forms. Think about it: in 1929, the market dropped a whopping 89% based on S&P-like numbers. Meanwhile, the crash in 2001 sliced nearly 78% off Nasdaq’s value by October 2002, and during the 2008 downturn, the S&P 500 fell by 57%. It’s eye-opening to see how each crash struck the markets differently.
Each downturn also lasted for a different amount of time. The 2001 slump took around 26 months, while the 1929 collapse dragged on for 34 months, and the 2008 drop wrapped up in just 17 months. This meant that investors felt uncertainty for a long stretch in 1929, whereas the shorter 2008 crash allowed markets to bounce back quicker. It really shows how timing can change the recovery journey.
Another key point is how each crash affected banks. The 2001 crash saw fewer bank failures compared to both 1929 and 2008. Even though banks were hit hard, they managed to hold on better during the 2001 downturn. This tells us that the way financial systems are built can really shape the outcome of a market crisis.
Final Words
In the action, we traced the market crash of 2001 from its tech bubble burst to the fallout after September 11. We covered how overvalued tech shares, sudden investor panic, and rapid Fed moves shaped a tough timeline.
Our look at key dates, regulatory shifts, and recovery patterns paints a clear picture of past market stress. This honest review offers actionable insights to help guide smart, strategic decisions for the future.
FAQ
What were the main factors behind the market crash of 2001?
The market crash of 2001 stemmed from overvalued tech stocks, a downturn in corporate profits, speculative trading spikes, a crunch in available funds, and the shock from September 11, which triggered widespread investor panic.
How did the dot-com bubble burst affect technology stocks?
The burst of the dot-com bubble led technology stocks to drop significantly, as soaring price-to-earnings ratios and margin trading losses left the Nasdaq losing roughly two-thirds of its value and wiping out over $5 trillion in market capitalization.
How did the events of September 11 influence market performance?
The events of September 11 shook market confidence, forcing trading closures and sparking a dramatic drop—such as a 7.1% loss on the Dow when it reopened—while causing deep drops in airline, insurance, and tourism sectors.
What government and Federal Reserve actions helped stabilize the markets?
In response to the crash, the Federal Reserve cut its funds rate significantly over the course of 2001, while government interventions like tax rebates and new compliance measures restored investor trust and helped stabilize the sector.
How did the recovery timeline unfold after the crash?
The recovery unfolded gradually, with stock indices bottoming by late 2002 before slowly rebounding over the next year. Economic indicators such as GDP growth and decreased unemployment signaled a sustained rebound.
How does the 2001 market crash compare with other major stock market crashes?
When compared to other crashes, the 2001 decline was deep and prolonged but featured fewer systemic bank failures. Its duration and recovery contrasted with the 1929 and 2008 crashes, marking a unique pattern in market history.